
Analytics Report
📈 Analyze the transaction results
The analytics report screen displays the average processing time to complete certain events, and other transaction statistics, such as the number of liveness and capture attempts, the percentage of the type of devices being used, etc.
Follow the steps below:
- Click on the Reports module.
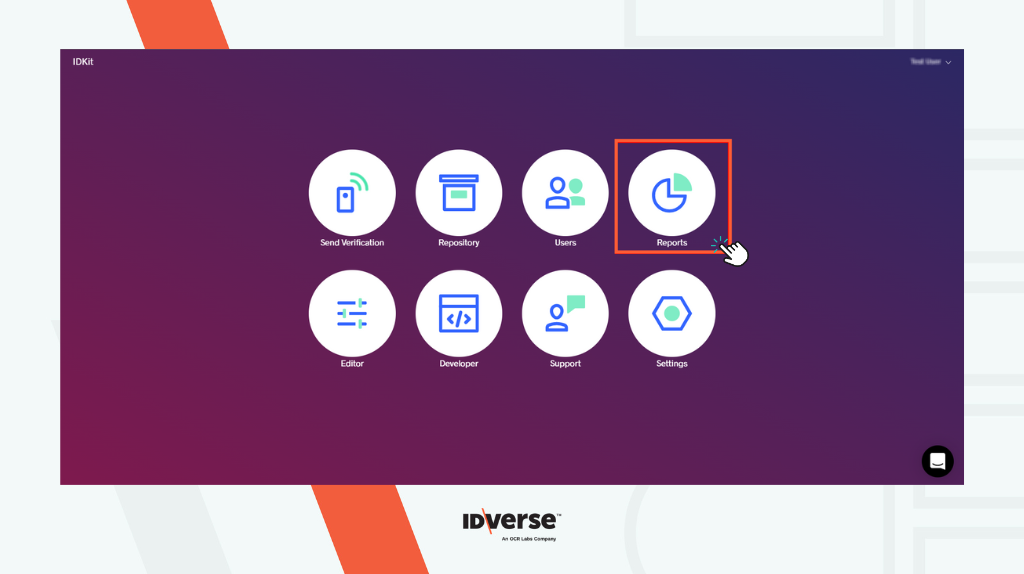
- After that, you will see the Analytics report page, as shown in the image below.
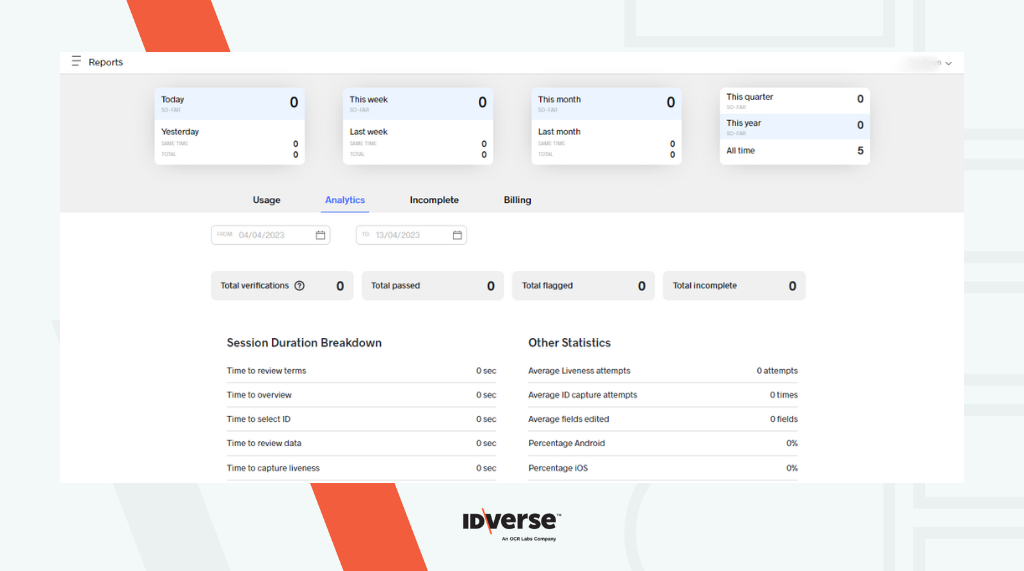
Features
Search Filter
You can search the analytics statistics within a specified period by using the date filter.
- Choose the start date from the From date field.

- Choose the end date from the To date field.
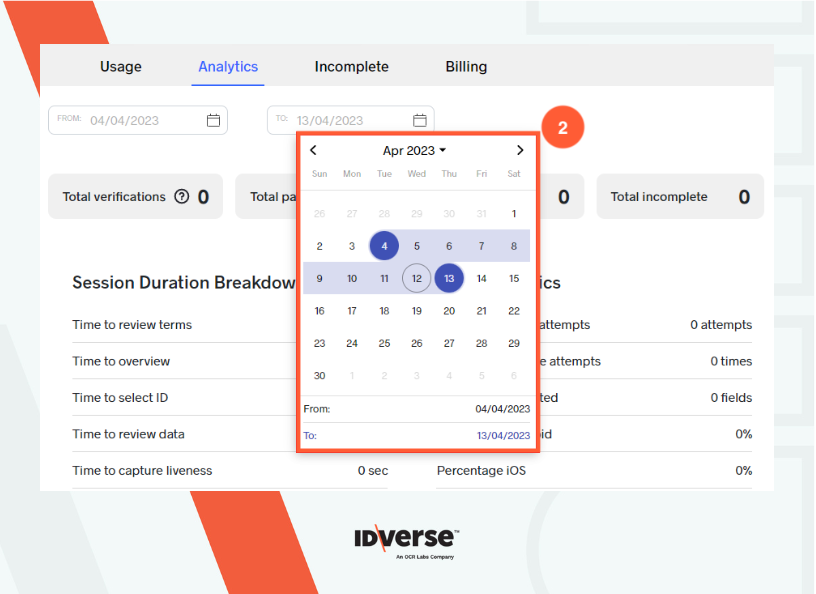
👍 The analytics data will be shown based on the period selected, as shown in the illustration below.
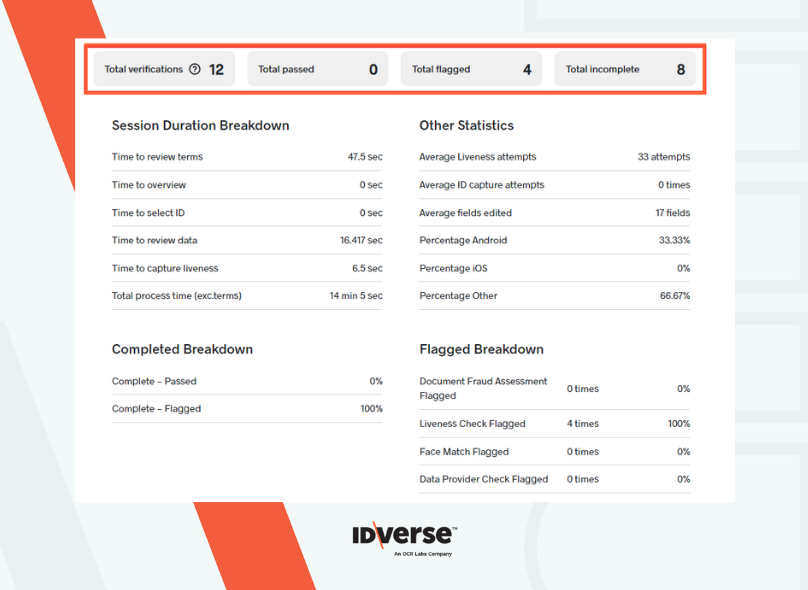
Analytics Overview
- Total Verifications: The total number of verifications, whether completed or incomplete.
- Total Passed: The number of completed transactions declared passed.
- Total Flagged: The number of completed transactions declared flagged.
- Total Incomplete: The number of incomplete transactions, whether expired or cancelled (verifications in progress are not included).
Analytics Report Breakdown
The analytics report is divided into 4 main sections:
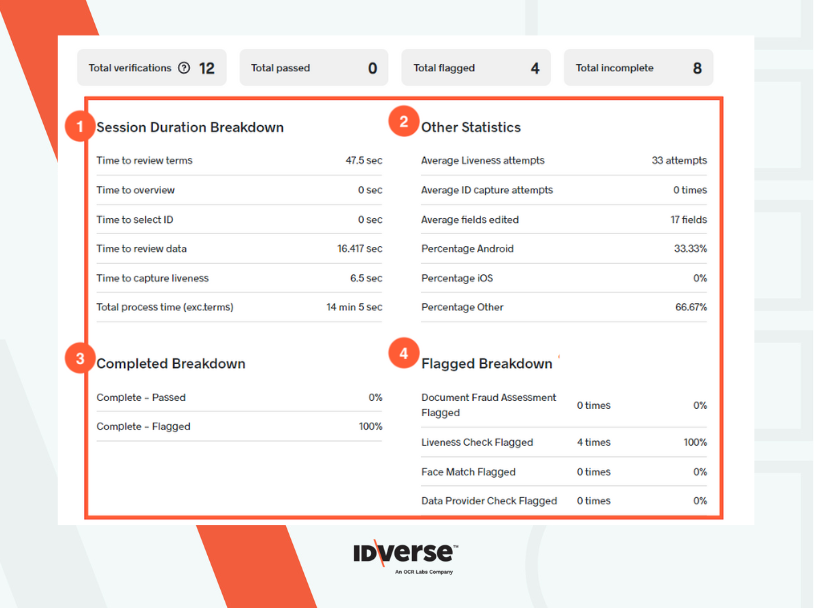
1. Session Duration Breakdown
This section contains details of the time taken by the users on certain screens. See the details in the table below.
| Reports | Description |
|---|---|
| Time to review terms | The time (in seconds) the user takes to review the terms and conditions. |
| Time to overview | The time (in seconds) the user takes on the overview page. |
| Time to select ID | The time (in seconds) the user takes to select the ID for verification. |
| Time to review data | The time (in seconds) the user takes to review the uploaded data. |
| Time to capture liveness | The time (in seconds) the user takes to do the liveness attempt. |
| Total process time (exc. terms) | The total duration (in seconds) of the whole verification process without review terms duration. |
2. Other Statistics
This section contains the details of average liveness and ID capture attempts, percentage device usage, along with a few other statistics. See the details in the table below:
| Reports | Description |
|---|---|
| Average Liveness attempts | An average number of video capture attempts. |
| Average ID capture attempts | An average number of image/selfie capture attempts. |
| Average fields edited | An average number of fields that users modify. |
| Percentage Android | A percentage of the Android devices that the users used when doing the verification. |
| Percentage iOS | A percentage of the iOS devices that the users used when doing the verification. |
| Percentage Other | A percentage of other devices that the user used when doing the verification. |
3. Completed Breakdown
This section contains a breakdown of the completed verifications. It displays the percentages of passed and flagged verifications.
4. Flagged Breakdown
This section contains a breakdown of the flagged verifications. See the details in the table below:
| Reports | Description |
|---|---|
| Document Fraud Assessment Flagged | A percentage of verifications flagged due to document fraud assessment failure. |
| Liveness Check Flagged | A percentage of verifications flagged due to liveness/video check failure. |
| Face Match Flagged | A percentage of verifications flagged due to failed face-match checks between the captured image/video and the ID uploaded. |
| Data Provider Check Flagged | A percentage of verifications flagged due to data provider check session failures. |
💬 We Are Here to Help!
If you encounter an issue, a bug, or require assistance, please contact our support page here to find the solution. Don't forget to provide any important information on the issue.
Updated 8 months ago