
Usage Report
📊 Want to track the transaction statistics? We got you covered!
The usage report contains visual charts of daily transactions and the time of day users complete their verification. To access the Usage report, follow the steps below:
- Click on the Reports module.
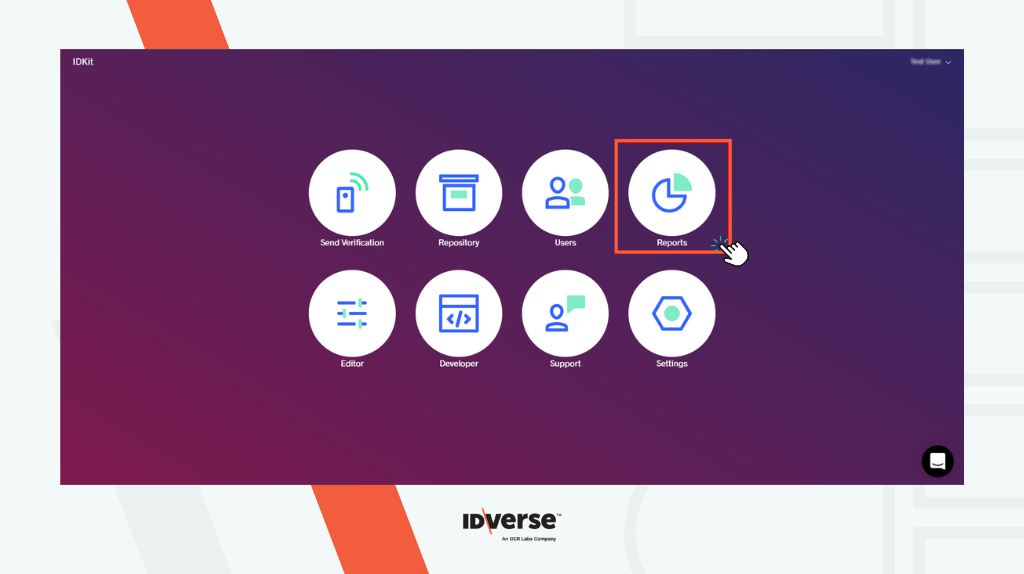
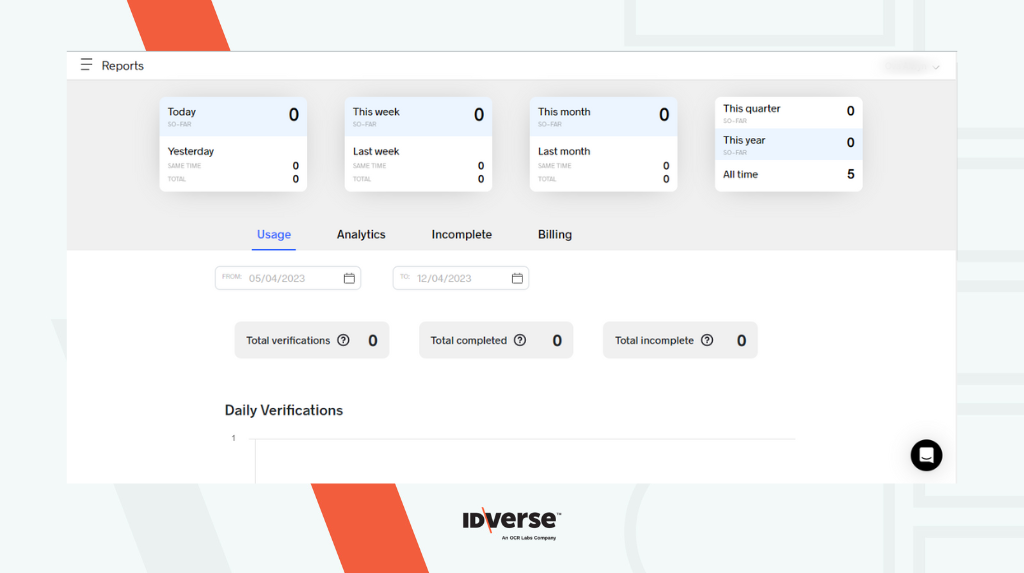
- You will see the Usage report page, like the image below.
Features
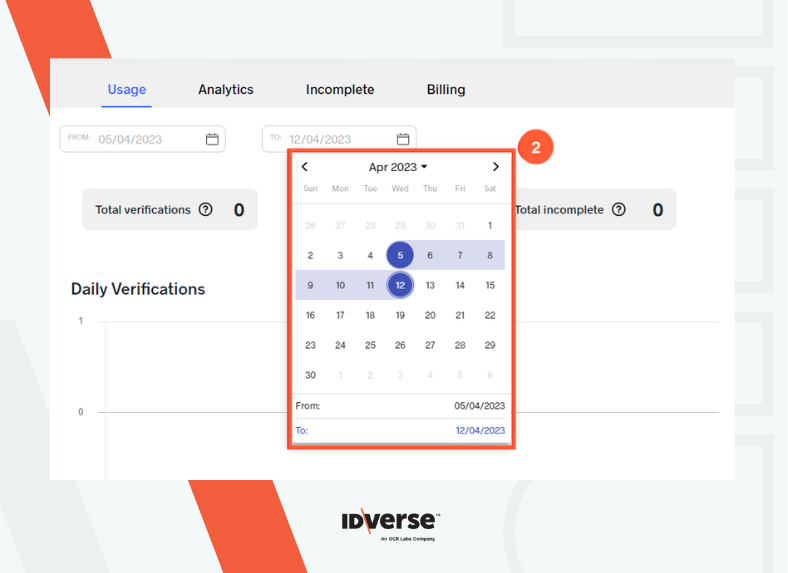
Search Filter
Search usage statistics within a date range by using our search filter.
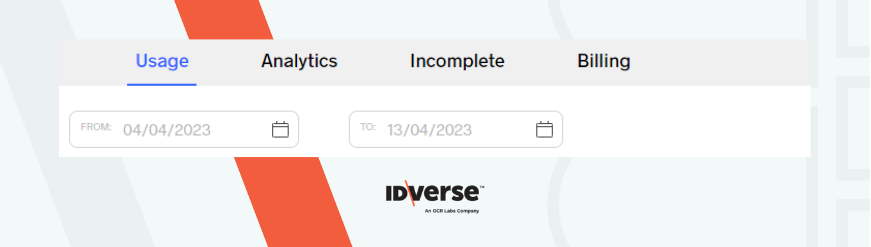
- Click on the From field to set the starting date. A calendar will pop out so you can easily select the date.
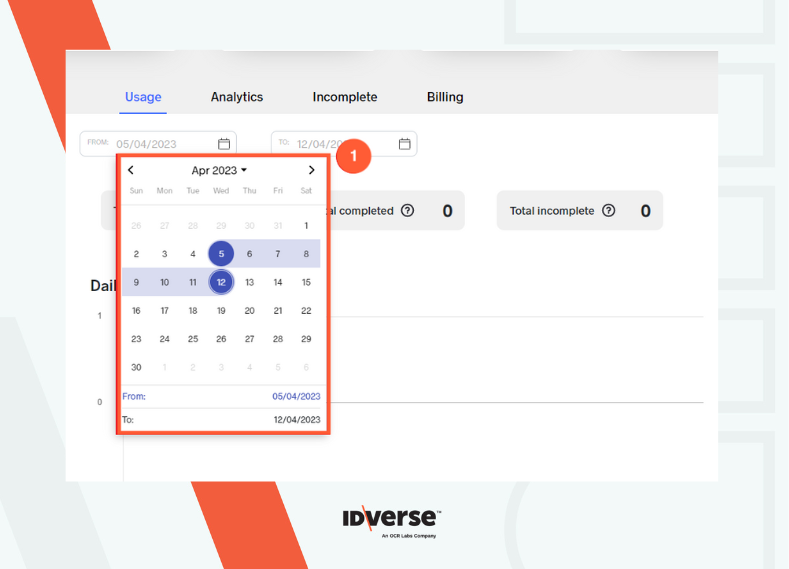
- Set the ending date by picking the date from the To calendar field.
Verification Statistics Overview
The verification statistics give an overview of total transactions. It has the following segments:
- Total verification: The total amount of verifications, whether completed or incomplete.
- Total completed: The total number of completed verifications.
- Total incomplete: The total number of incomplete verifications.
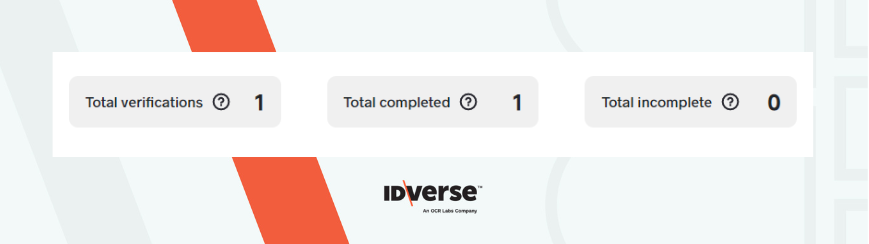
Info:
The number depends on the range you have adjusted.
Daily Verifications
Daily Verifications is a line chart representing the number of verifications generated daily. It has days on its x-axis and the number of verifications on its y-axis.

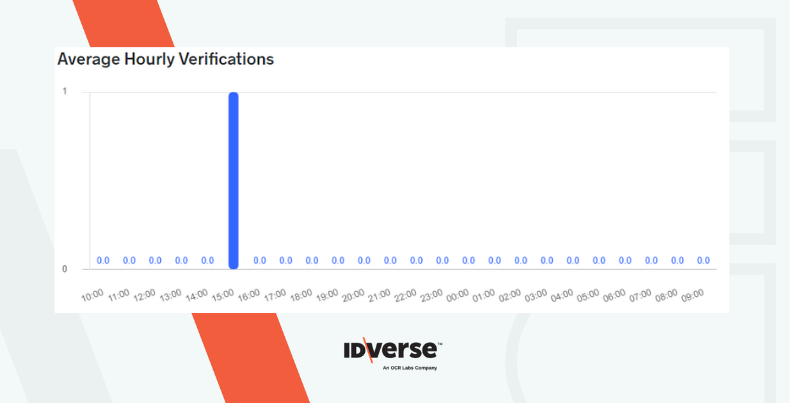
Average Hourly Verifications
Average Hourly Verifications is a bar chart representing the time of the day average users did the verification. It has time on its x-axis and the average number of end-users on its y-axis.
💬 We Are Here to Help!
If you encounter an issue, a bug, or require assistance, please contact our support page here to find the solution. Don't forget to provide any important information on the issue.
Updated 8 months ago